You will be creating a single-page web application using Dash (a python framework) and some machine learning models which will show company information (logo, registered name and description) and stock plots based on the stock code given by the user. Also the ML model will enable the user to get predicted stock prices for the date inputted by the user.
Objective
Project Context
Stock investments provide one of the highest returns in the market. Even though they are volatile in nature, one can visualise share prices and other statistical factors which helps the keen investors carefully decide on which company they want to spend their earnings on.
Developing this simple project idea using the Dash library (of Python), we can make dynamic plots of the financial data of a specific company by using the tabular data provided by yfinance python library. On top of it we can use a machine learning algorithm to predict the upcoming stock prices.
This project is a good start for beginners in python/data science and a good refresher for professionals who have dabbled in python / ML before. This web application can be applied to any company (whose stock code is available) of one's choosing, so feel free to explore!
Project Stages
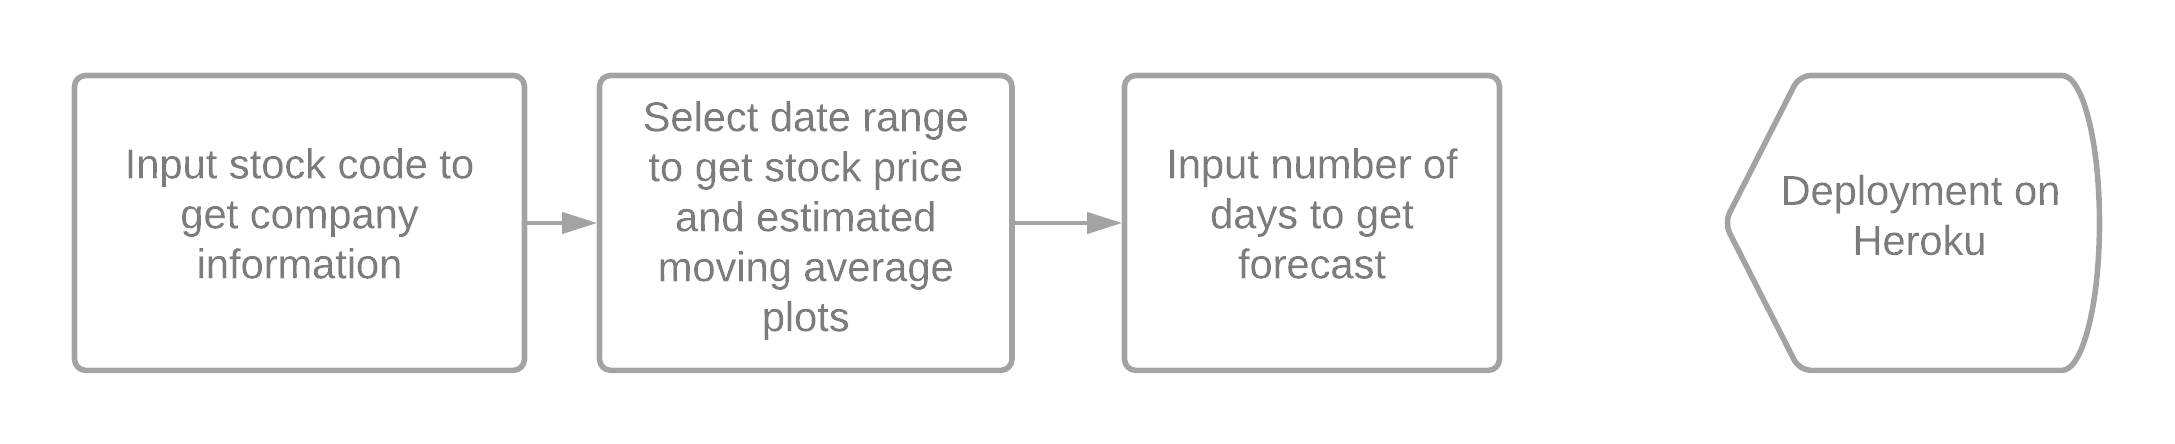
High-Level Approach
- Make the main website's structure using mainly Dash HTML Components and Dash Core Components.
- Enhance the site's UI by styling using CSS
- Generate plots of data using the
plotlylibrary of Python. The data is fetched usingyfinancepython library - Implement a machine learning model to predict the stock price for the dates requested by the user.
- Deploy the project on Heroku to host the application live.
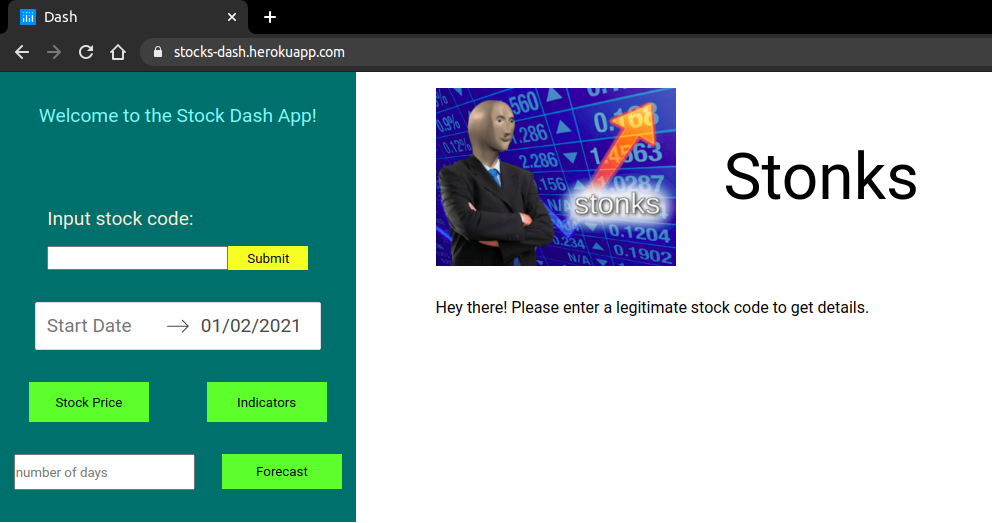
The end result of this project would look something like this:
Objective
You will be creating a single-page web application using Dash (a python framework) and some machine learning models which will show company information (logo, registered name and description) and stock plots based on the stock code given by the user. Also the ML model will enable the user to get predicted stock prices for the date inputted by the user.
Project Context
Stock investments provide one of the highest returns in the market. Even though they are volatile in nature, one can visualise share prices and other statistical factors which helps the keen investors carefully decide on which company they want to spend their earnings on.
Developing this simple project idea using the Dash library (of Python), we can make dynamic plots of the financial data of a specific company by using the tabular data provided by yfinance python library. On top of it we can use a machine learning algorithm to predict the upcoming stock prices.
This project is a good start for beginners in python/data science and a good refresher for professionals who have dabbled in python / ML before. This web application can be applied to any company (whose stock code is available) of one's choosing, so feel free to explore!
Project Stages
High-Level Approach
- Make the main website's structure using mainly Dash HTML Components and Dash Core Components.
- Enhance the site's UI by styling using CSS
- Generate plots of data using the
plotlylibrary of Python. The data is fetched usingyfinancepython library - Implement a machine learning model to predict the stock price for the dates requested by the user.
- Deploy the project on Heroku to host the application live.
The end result of this project would look something like this:
Getting started with required files and dependencies
First validate the idea by doing a low level implementation (Proof of Concept) of the components involved in this project.
This helps you to:
- Get more clarity around the unknowns.
- Get a better understanding of the stages involved in the project.
We are going to set up the project's environment by setting up the application's starter files/folders. Also the dependencies to be installed will be covered here.
Requirements
-
In your working directory, you can create the following file structure.

-
You may follow the convention mentioned below -
-
app.pycontains web layout and server function. We will be referring to it as our main file. -
model.pyis where we will implement a machine learning model for forecasting the stock price. -
The
assetsfolder is where we keep our CSS files for styling and any other miscellaneous files like images (if u wish to include it in your site) -
requirements.txtis created so that other developers can install the correct versions of the required Python packages to run your Python code. -
The
Procfileis created for deployment using Heroku. It is not needed to run the app locally.
-
-
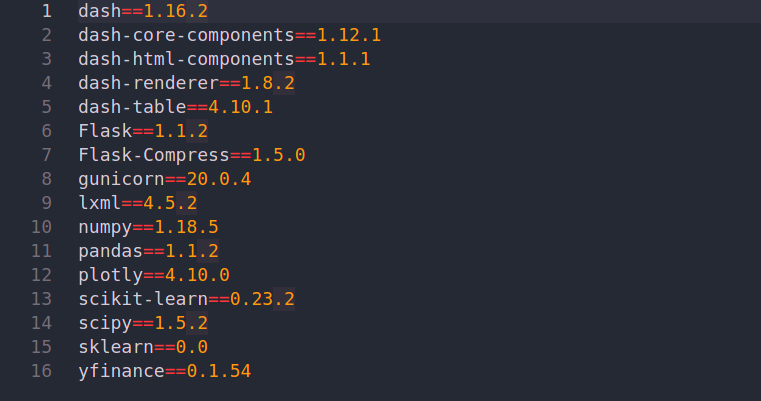
Install necessary libraries using pip package installer. It is recommended to use the following packages/libraries for this project.
Tip
- While installing the packages (preferably while using the terminal) you can install multiple packages/libraries in a single line of command (by separating them by spaces) like this:
$ pip install lib1 lib2 lib3
Note
numpylibrary is used for multi-dimensional array operations.pandasis used for creating DataFrames to efficiently manage the data.yfinanceis a library that allows us to fetch financial data of a company (since its listing in the stock market) from its stock code directly.gunicornandlxmllibraries will be used for the application's deployment i.e. to host the app on a target server.sklearnandscikit-learnare tools used in the development of Machine Learning (ML) models.
Create basic website layout
The basic layout of the application will be built using Dash in this task.
Requirements
-
Import relevant libraries as shown below:
import dash import dash_core_components as dcc import dash_html_components as html from datetime import datetime as dt -
Create a Dash instance and store it in an
appvariable. Also, store the application's server property in aservervariable as it will be frequently used.app = dash.Dash(__name__) server = app.server -
Make the web layout using Dash HTML Components and Dash Core Components, then store it in the app's layout component i.e. the
app.layout. Your code should look something like this :app.layout = html.Div([item1, item2]) -
We mainly need two divisions (.Div) for the entire layout.
-
The first one is for our inputs like stock code, date range selector, number of days of forecast and buttons. These components are the ones which the user will be interacting with. They should be given appropriate IDs and class names for the upcoming tasks. You can follow the code given below:
html.Div( [ html.P("Welcome to the Stock Dash App!", className="start"), html.Div([ # stock code input ]), html.Div([ # Date range picker input ]), html.Div([ # Stock price button # Indicators button # Number of days of forecast input # Forecast button ]), ], className="nav") -
The second division will be for the data plots and company's basic information (name, logo, brief intro) only. Leave the divisions inside them as blank and give unique IDs because these will get updated as you will see in the next task. You can refer to the code below :
html.Div(
          [
            html.Div(
                  [  # Logo
                    # Company Name
                  ],
                className="header"),
            html.Div( #Description
              id="description", className="decription_ticker"),
            html.Div([
                # Stock price plot
            ], id="graphs-content"),
            html.Div([
                # Indicator plot
            ], id="main-content"),
            html.Div([
                # Forecast plot
            ], id="forecast-content")
          ],
        className="content")
-
-
Write the following at the end of the main file for running the app in development mode (mandate this step for now)
if __name__ == '__main__':
    app.run_server(debug=True)
References
Note
- Dash HTML Components are similar to HTML syntaxes, so try relating the two syntaxes together.
- Dash Core Components are useful for buildings certain things like input methods (text, number, range, slider etc).
- The equivalent of HTML's
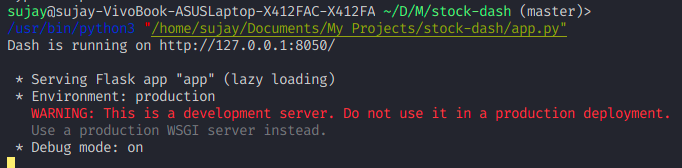
classisclassNamein Dash layout. DatePickerRangecomponent allows the user to pick a start and end date. It will be used to update the stock plots accordingly.- Use the following command in the terminal of the working directory to run your Dash app's server locally -
$python3 app.py
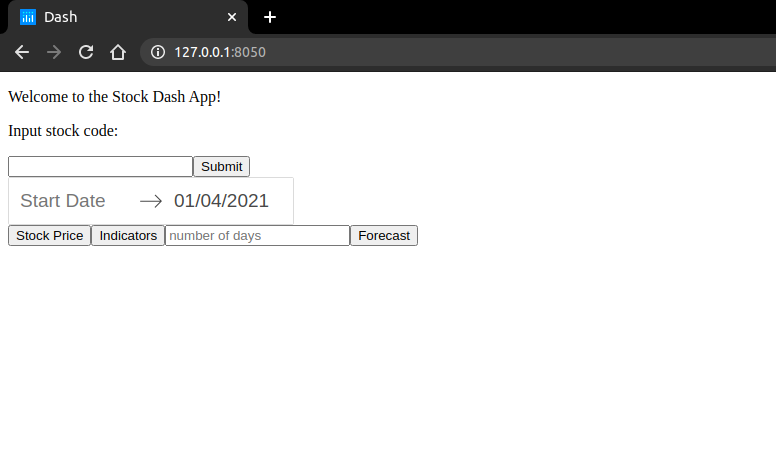
Expected Outcome
By now you should have the basic web page setup (as shown below in the second image) which can be seen by starting the server locally (as shown below in the first image).
Styling the application's web page
Using CSS we will style our webpage to make it look more neat and user friendly.
Requirements
- Give a class name to the parent division (the one which contains both our main divisions) you created in Task 1. Name it something appropriate like
container. - Style the
containerdivision by giving thedisplaypropertyflexvalue. This will ensure that both the divisions are laid out in the same horizon.
.container {
  display: flex;
}
- Similarly, style the first division (the one containing our inputs). Again, give the
displaypropertyflexvalue and theflex-directionpropertycolumnvalue. Give it a suitable width too, ideally less than 40%. You can keep the items aligned at the center.
.inputs {
  width: 25vw;
  align-items: center;
  display: flex;
  flex-direction: column;
  justify-content: flex-start;
  background-color: rgb(5, 107, 107);
}
- Give class names to any of the components you want to further style.
References
Tip
- You can apply some styles to the entire web page simply by using the
*selector.
  * {
  margin: 0;
  padding: 0;
  box-sizing: 0;
  font-family: "Roboto", sans-serif;
}
Bring it On!
- Enhance your webpage by exploring and improving the styling
Expected Outcome
At this stage, your webpage should have a much better look than before. You may use the below web page as your starter template -

Generating a company's information and graphs
Requirements
-
In the main file, import relevant libraries as shown below
import yfinance as yf import pandas as pd import plotly.graph_objs as go import plotly.express as px -
Make callback functions to update the empty divisions (
.Div) we created in the basic web layout previously(for company information, stock graph and indicator graph ). Dash's callback functions are called whenever an input component's property changes. List out theOutputalong with their respective IDs and property of the components you want to change. After that list theInputalong with their IDs and property of the components which will be used as a trigger for the change in Output components. You may also enlistStateto just use the component values without using them as a trigger. You may refer to the code example below.@app.callback([ Output("component-id-1", "property"), Output(# Output of component-id-2), ], [Input(# Input of component-id-2)], [State("component-id-4", "property")]) def update_data(arg1, arg2): # input parameter(s) # your function here return output1, output2 -
In the first callback function, use the input field (for stock code) and submit buttons as
StateandInputcomponents respectively. For theOutputcomponent use the first emptyDivyou had created in Task 2. Use the yfinance library'sTickerfunction to fetch the company info and return it from the first callback function (you may refer to the code snippet below)ticker = yf.Ticker(val) inf = ticker.info df = pd.DataFrame().from_dict(inf, orient="index").T return # df's first element of 'longBusinessSummary', df's first element value of 'logo_url', df's first element value of 'shortName' -
For making the second callback function, use the date range picker's start date, end date and also the stock price button as
Inputcomponents. For theOutputcomponent use the second emptyDivwe had created in Task 2. You can download the stock price history with thedownloadfunction of theyfinancelibrary. We get a DataFrame in return. You can pass that DataFrame to a user defined function (which we will make) that returns the required plot (usingplotlylibrary). Finally, that plot can be returned from our callback function as a Dash Core Component Graph. You may refer to the code examples below.df = yf.download(# input parameter, start_date str, end_date str ) df.reset_index(inplace=True) fig = get_stock_price_fig(df) return # plot the graph of fig using DCC functionUser defined function for stock price graph generation from a given DataFrame
def get_stock_price_fig(df): fig = px.line(df, x= # Date str, y= # list of 'Open' and 'Close', title="Closing and Opening Price vs Date") return fig -
The third callback will be for generating our indicator graph. You may use estimated moving average (EMA) for it. The callback function for it will be similar to the second one. However, we need to make a new user defined function which will return an EMA plot over time. You can refer to the code given below
def get_more(df): df['EWA_20'] = df['Close'].ewm(span=20, adjust=False).mean() fig = px.scatter(df, x= # Date str, y= # EWA_20 str, title="Exponential Moving Average vs Date") fig.update_traces(mode= # appropriate mode) return fig -
Till here we have completed the
app.pyfile, i.e. the web layout and server functions are in place and hence the app is partially functional (prediction feature is yet to be implemented).
Note
- You will most likely encounter many callbacks errors in Dash. This is because Dash had stopped supporting 'events' after a particular version. You may try using properties like
n_clicksinstead. - Specifically, the callbacks are supposed to trigger some action when a given input parameter changes. To overcome unnecessary updates, use the
raise PreventUpdatestatement. - We will have to make another callback function for the ML model later.
Expected Outcome
By now, your webpage should get updated by the respective inputs. You should be able to display company info and the dynamic plotly graphs
Creating the machine learning model
We are now going to build a machine learning model - Support Vector Regression (SVR) for predicting the stock prices.
Requirements
- Make the model in the
model.pyfile. - Use the support vector regression (SVR) module from the
sklearnlibrary. Fetch the stock prices for the last 60 days. Split the dataset into 9:1 ratio for training and testing respectively. - Use the rbf kernel in
GridSearchCVfor tuning your hyperparameters. - Then, train the SVR model with the training dataset.
- Test your model's performance by using metrics such as Mean Squared Error (MSE) and Mean Absolute Error (MAE) on the testing dataset.
- After the model is built, make sure another callback function (as seen in Task 2) for the same is made in the main file i.e.
app.py(where the model is to be imported).
References
Tip
- If the testing results are poor you can try changing the train-test split ratio or even modify the gridsearch values. You can visit here for more enhancements.
- LSTM is a deep learning model and gives us far more accurate results when compared to Support Vector Regression.
Note
- Try to tune the C, epsilon and gamma parameters in the grid search. Then use them to train the SVR model.
- Keep in mind that stock prices are volatile and using a deep learning model might yield better results for larger training sets.
Expected Outcome
After finishing all this, we should have a complete project where user input - stock, code can give us the company information and relevant plots. Also, user input number of days can give us a forecast plot.
Deploying the project on Heroku
Requirements
-
Run
$ pip install gunicornin the terminal. -
Run
$ pip freeze > requirements.txtin the terminal. This creates a text file containing all our dependencies. -
Create a
Procfilein the working directory. In that pasteweb: gunicorn app:server -
Run
$ sudo snap install --classic herokuon terminal to install the Heroku CLI. -
In the terminal, run the commands below:
$ heroku create unique-name-here$ git add .$ git commit -m 'Initial app template'$ git push heroku master -
Finally, run the app on one dyno by doing
$ heroku ps:scale web=1
References
Note
- The URL should be generated after following the aforementioned steps. It should look like https://unique-name-here.herokuapp.com
- Heroku has some limitations on free plans. However, you can upgrade by paying a fee.
- In case of deployment errors, Heroku maintains a log of it for you to check out.
- You may use any other hosting services too if you are uncomfortable with using Heroku.
Expected Outcome
Finally, our web app is deployed and can be accessed by anyone in the world.